
From a feature request to a data problem
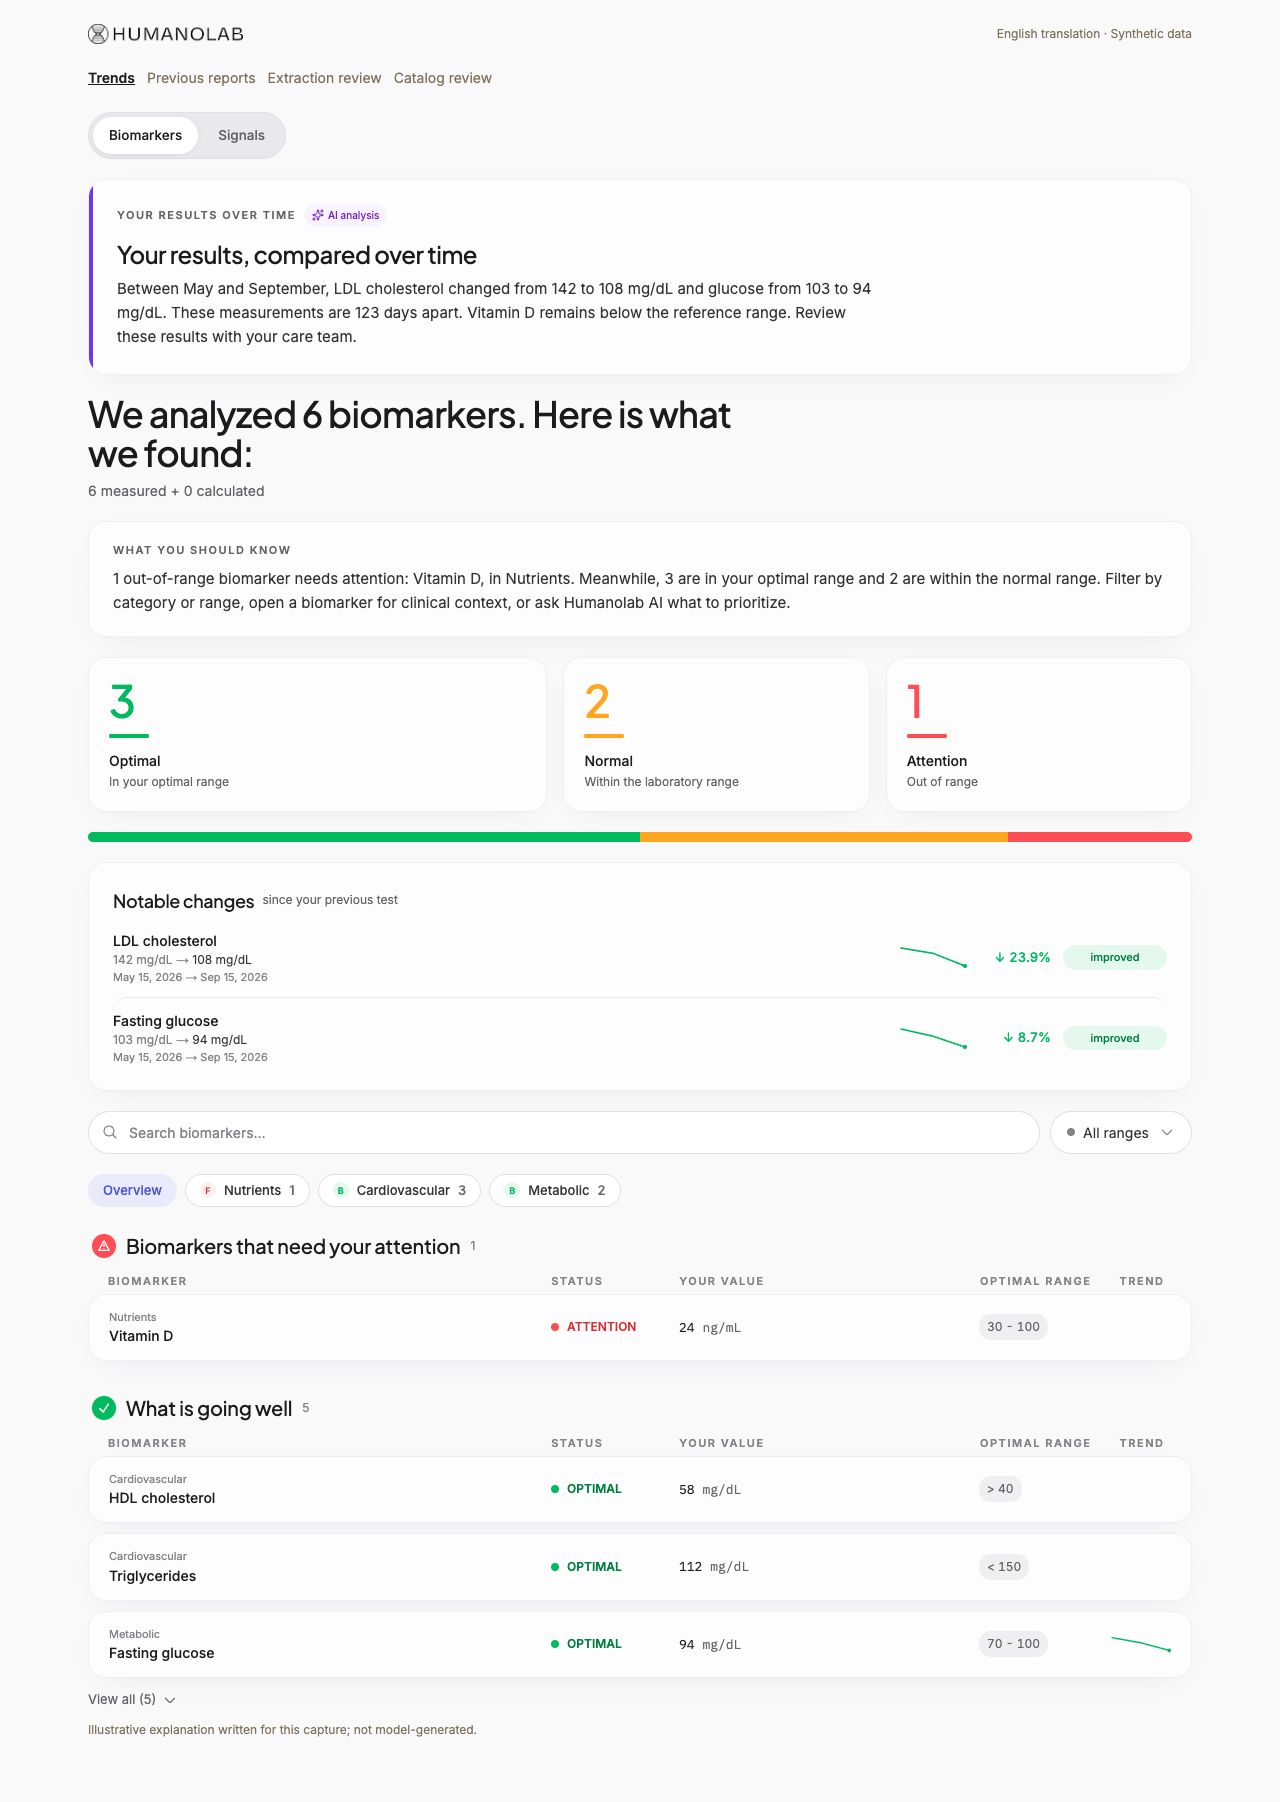
Members wanted to understand how their lab results changed over time. That meant comparing measurements across reports, even when different laboratories used different names for the same biomarker.
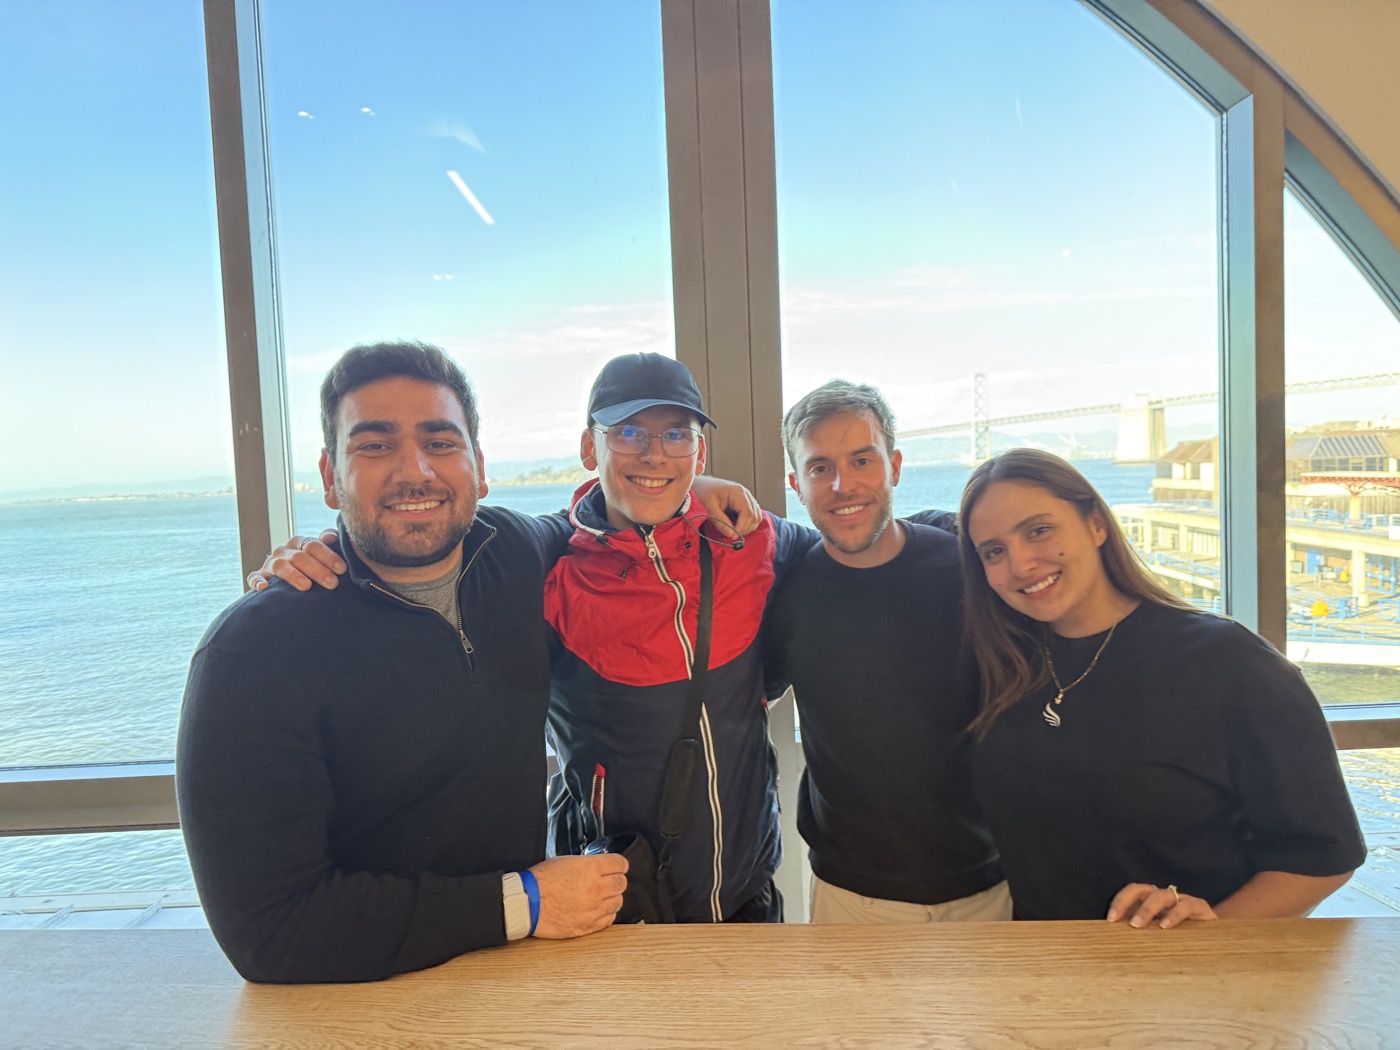
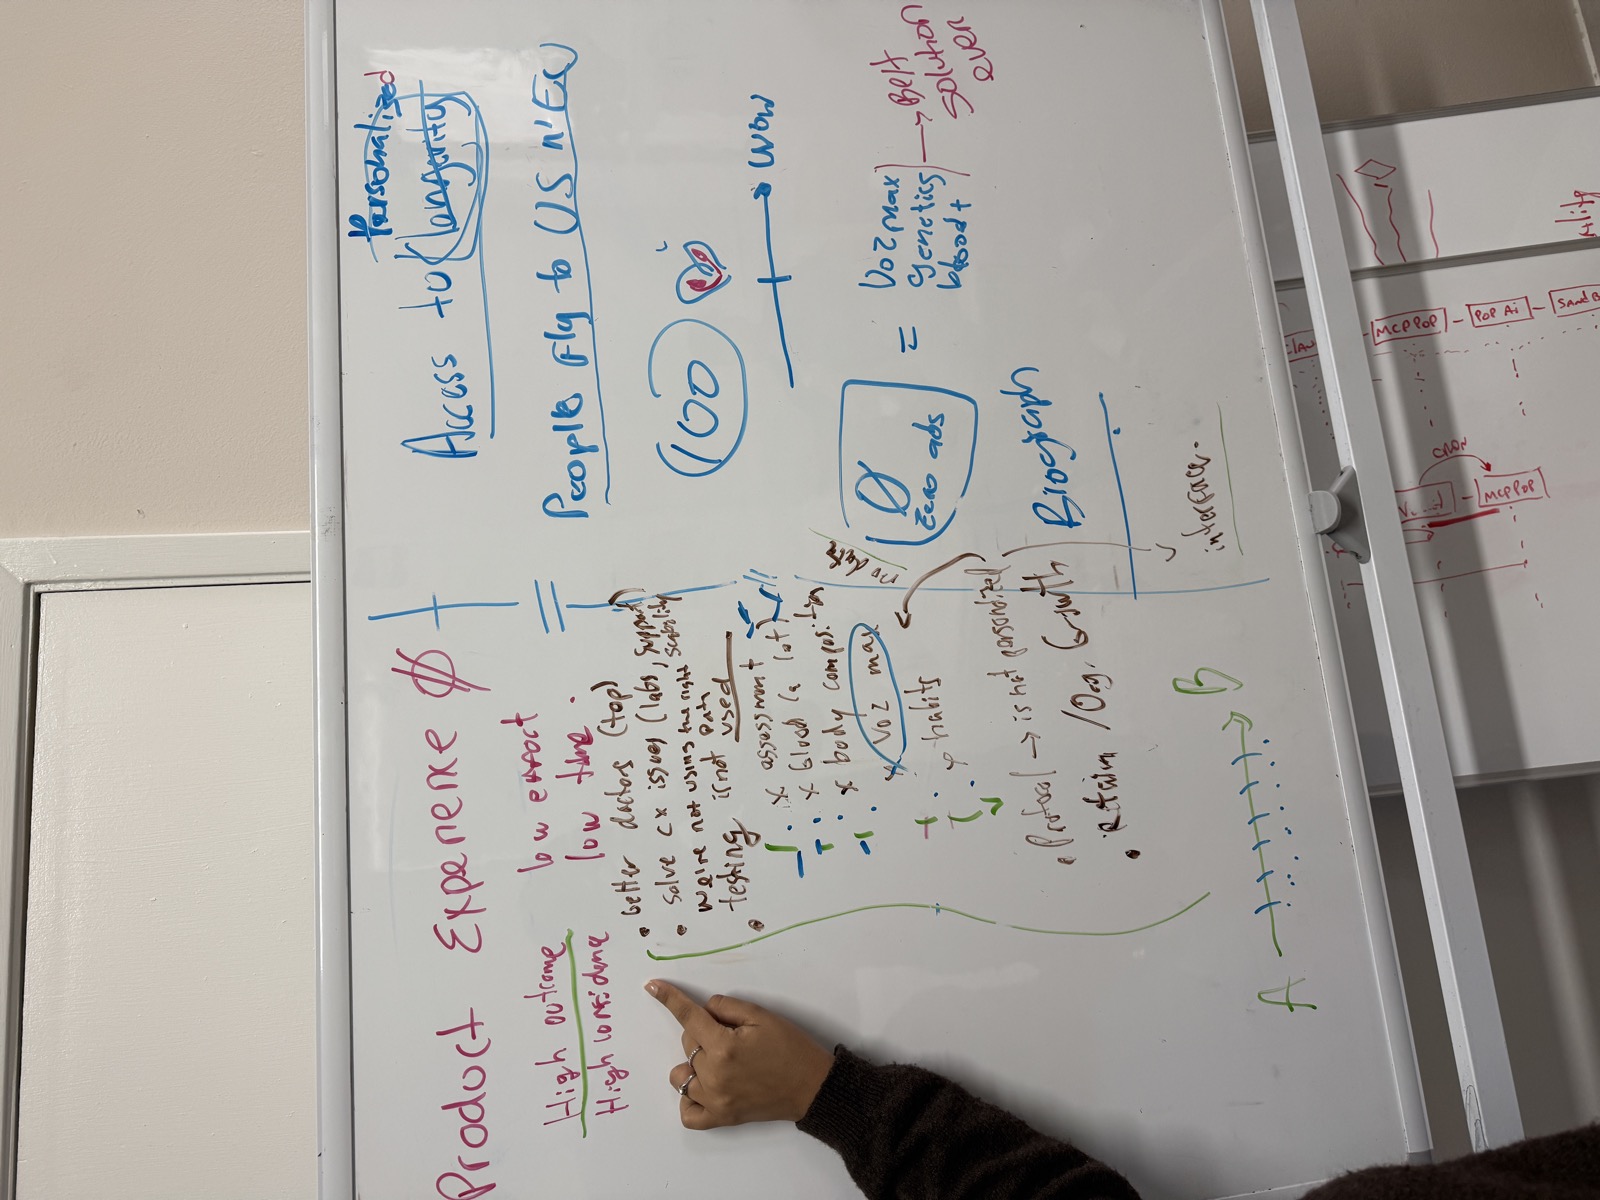
Working through the reports with the team revealed two connected problems: the existing PDF importer could extract values incorrectly, and we needed a consistent source of truth for what each result represented. The task grew from displaying comparisons to defining the data behind them.
The starting point: compare results over time
I brought earlier and later values, units, and dates together, with AI-generated explanations alongside the measurements.
The foundation: a shared data catalog
Reliable comparisons needed a stable identity for each biomarker across reports. In whiteboard workshops, I helped the team distinguish an orderable test (what the lab performs), a biomarker (what is measured), and a measurement (a dated value and unit). We also considered how wearable observations fit into that model.
I turned that shared model into a catalog of tests and biomarkers: a canonical source of truth for their identities and relationships. Different lab names could map to the same biomarker while each measurement retained its original wording, value, and unit. Review tools helped maintain that consistency as new reports arrived.
This approach also drew on my time at KLM as a UX designer and information analyst, where we mapped information across different software systems. It was rewarding to apply what I’d learned a few years earlier to a new domain.

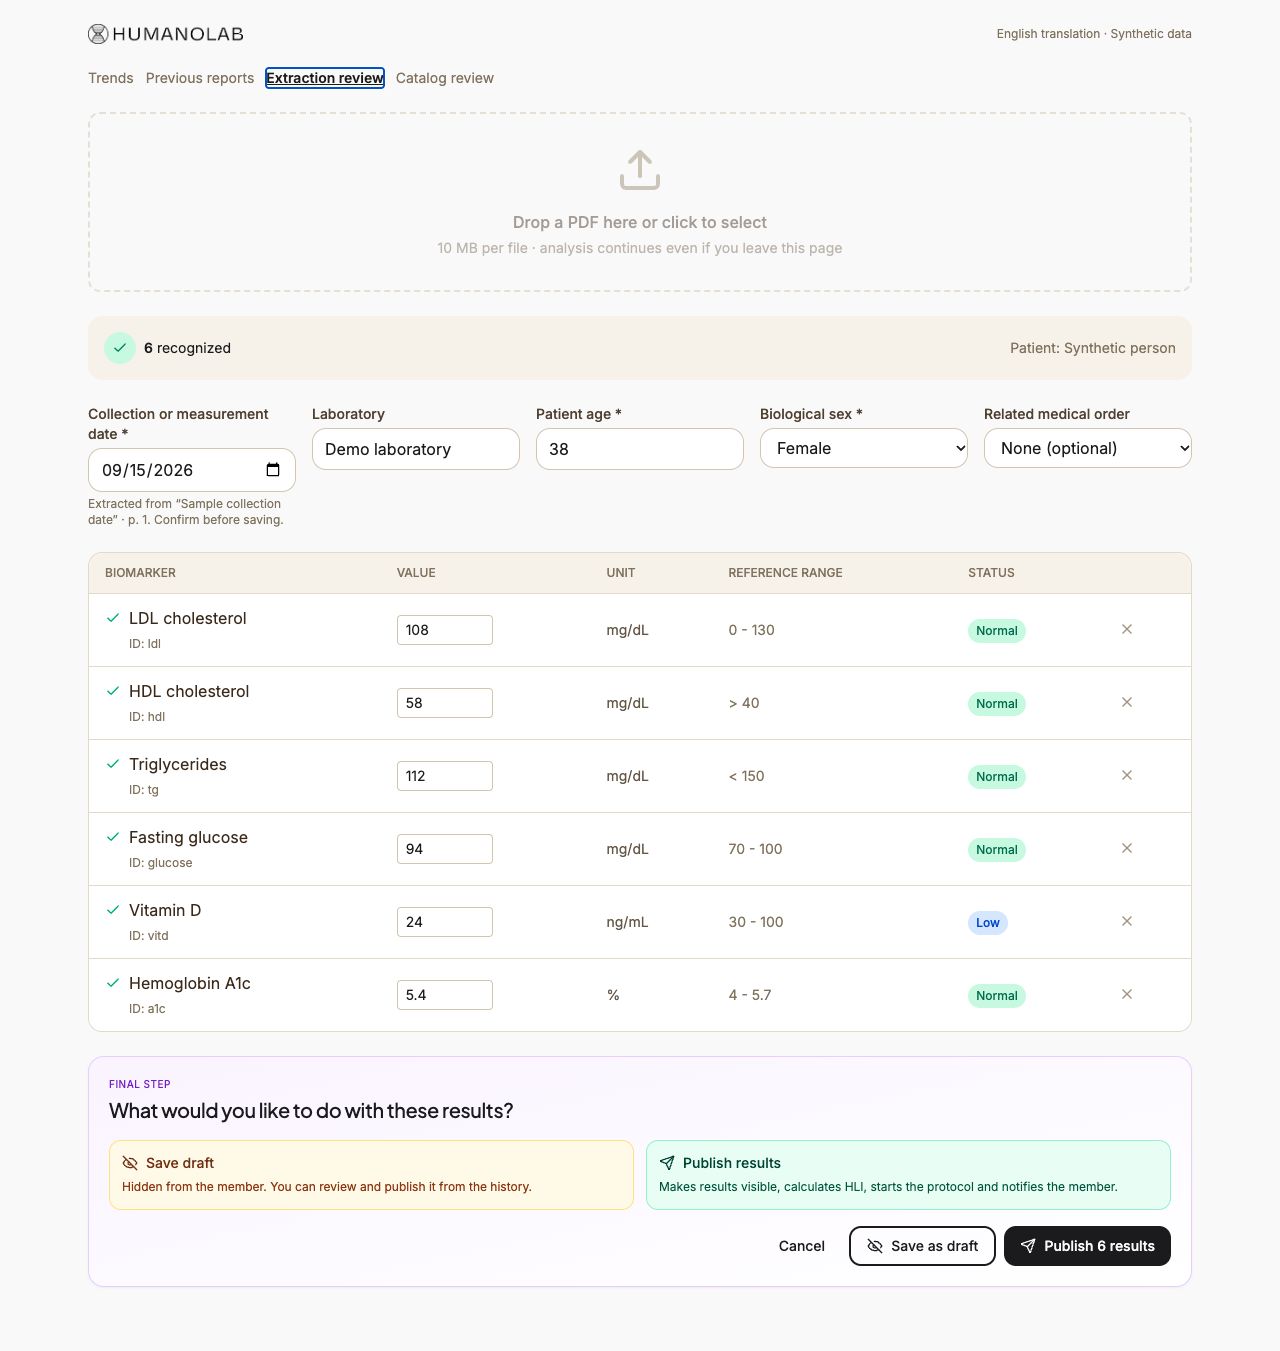
Review extracted values
I added a step to correct extracted values and confirm the measurement date before saving.
Resolve unfamiliar biomarkers
I introduced an administrator queue to link unfamiliar names to existing biomarkers, create new entries, or reject candidates.
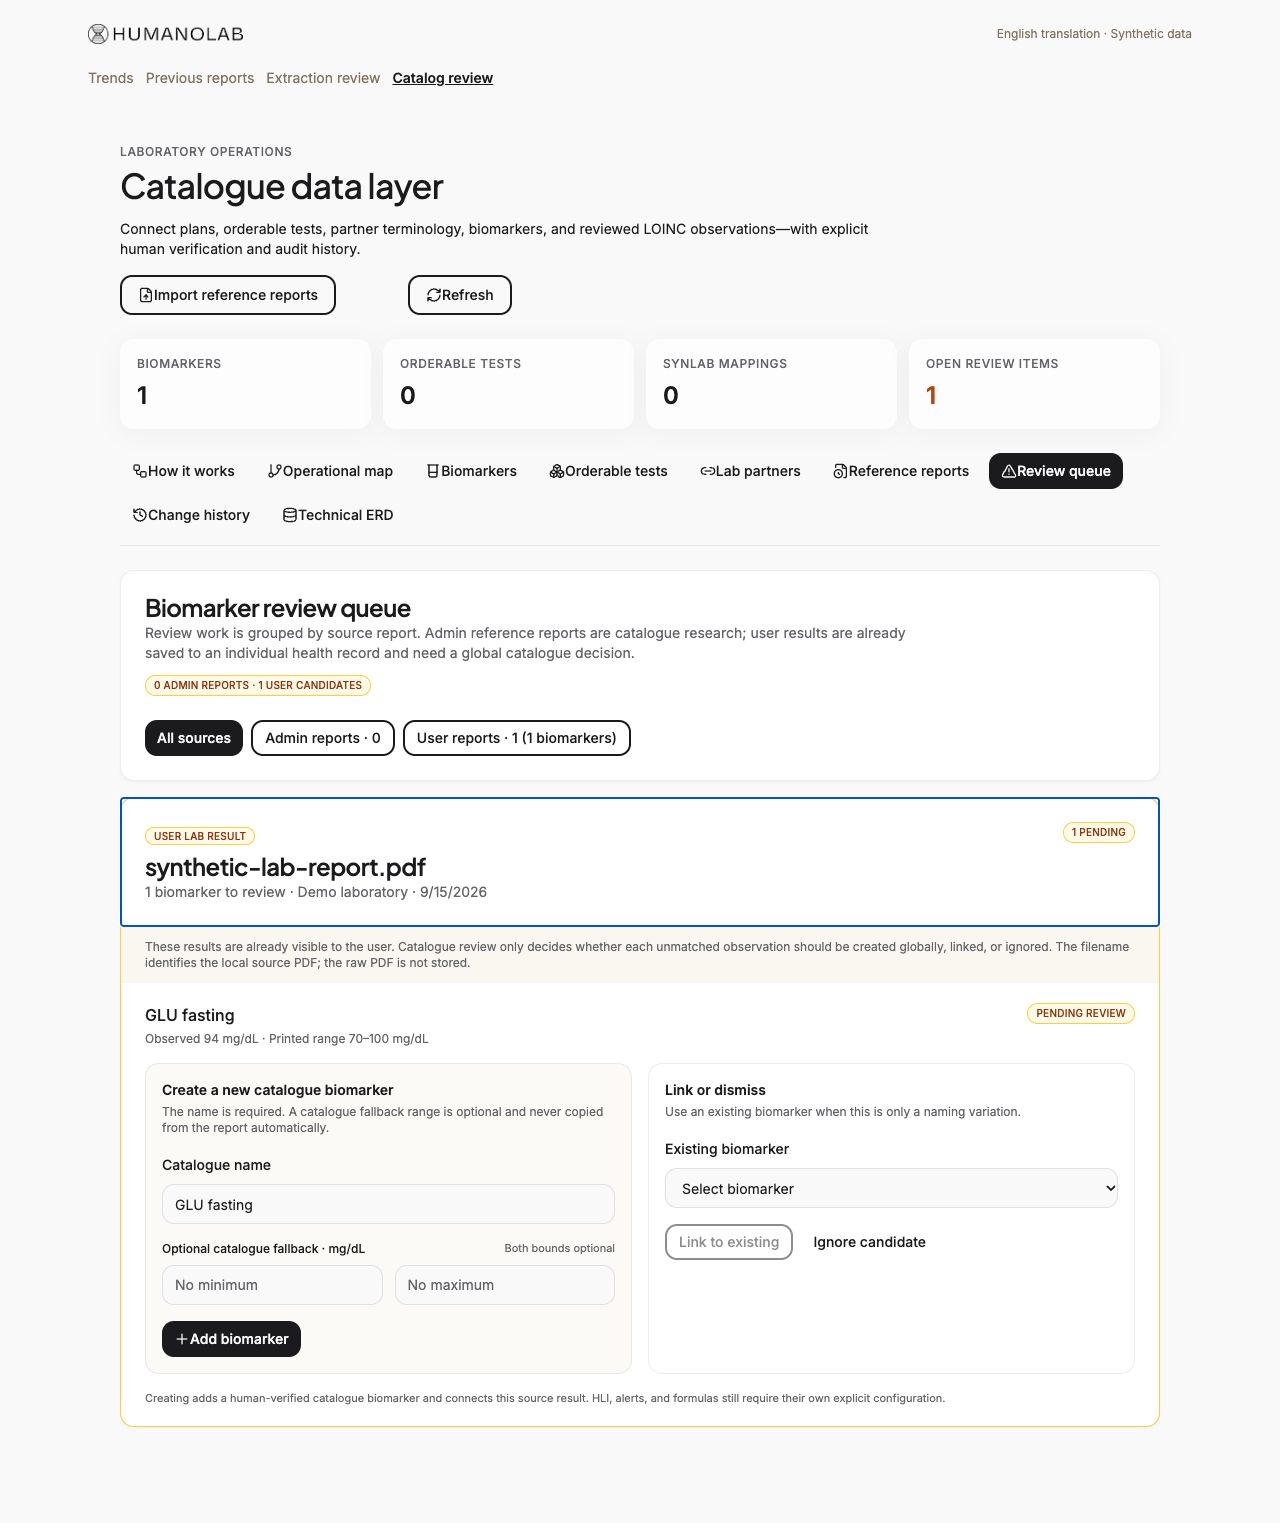
Catalog approval stays with people and is separate from publishing a member’s results.
Outcome and reflection
- Higher reported member satisfaction: team-reported ratings rose from 3.6/5 to 4.2/5 during my time at Humanolab. This broader product change cannot be attributed to these specific features.
- 33% less PDF processing time: splitting reports into chunks and processing them in parallel reduced a controlled synthetic 21-page test from 232.2 to 155.3 seconds, recovering all 168 expected values.
I owned these product decisions and their implementation. A request for clearer comparisons became a catalog and review workflow that supported them. The workshops helped us agree on what the data meant before encoding those distinctions in the product.